When George Mallory, a mountaineer in the early 1920s was asked why he wanted to climb Mount Everest, he is supposed to have answered „Because it’s there“.
I was recently asked why I created a Splunk App for Nextcloud and, although I didn’t say it out loud, the real answer to that question is probably „Because the data to do it is there“.
I’m a Splunk Sales Engineer. As such it is my job to demonstrate and explain what Splunk is. Other than the fact that I thought building a Splunk App for Nextcloud would be a fun project, I was also curious about how my own home-based Nextcloud server was being used.
The app I’ve built can now show information such as:
Number of users over time
Number of group, user and link shares over time
Number of files administrated by Nextcloud and the amount of free disk space
File and folder activity by time, action, location (where in the world were the users when they used Nextcloud)
Which files have been used the most over a chosen time period.
A breakdown of file activity by file extension.
Who did what to which files? Answers can be had to questions such as:
Who deleted a particular file and when?
What files were renamed by a particular user and when?
What file actions were performed on Monday between 12-14?
Where did failed logins from external or internal addresses originate from?
What names where used when there was a failed login?
What user agents where used when a failed login occurred?
When was Nextcloud updated and from what version?
For future versions I’m working on the app being able to answer questions such as:
Who created a new user?
When was John Doe’s password changed?
There is a wealth of information created by a Nextcloud system, the tricky bit is understanding what it all means and working out how to make use of it!
If you have heard about Splunk but otherwise have little or no experience with it, you may think it is just a log aggregation tool. But Splunk can work with any alphanumeric data, not just data from log files. Once data has been ingested, you can use Splunk to get all sorts of insights based on that data.
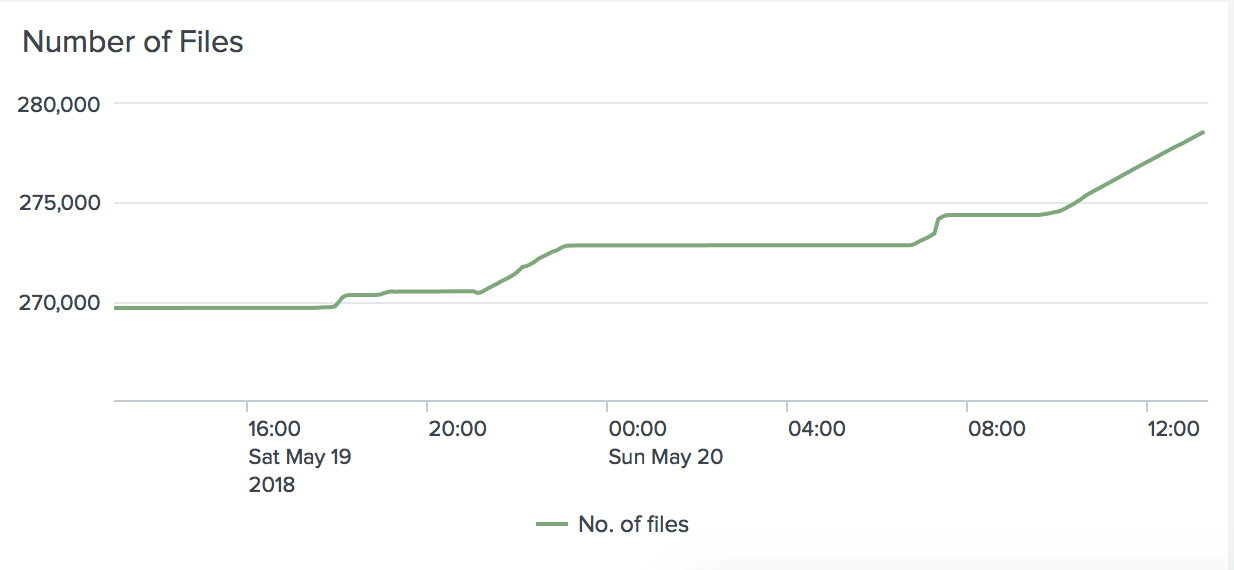
My Splunk App for Nextcloud journey started when Nextcloud introduced a monitoring API (go on, try it, as an admin in Nextcloud click on the letter (or picture) in the upper right corner of the Nextcloud UI. Click on Settings & Monitoring, scroll down to the very end where in the section External monitoring tool is the URL for your Nextcloud system. Copy and paste the URL shown into a browser address bar). The Monitoring app built into Nextcloud will give you information about your Nextcloud system here and now. It will for example tell you how many files are stored and administered by Nextcloud, but what did that number look like two days ago? A month ago? So I built a simple script that every 5 minutes pulls data via that monitoring API and feeds it to Splunk. Other than assigning a source type (a name by which you want to categorise certain data), that is all there was to it. Knowing a few Splunk commands (as an example enter this: sourcetype=nextcloud-serverinfo | timechart avg("ocs.data.nextcloud.storage.num_files") as "No. of files") and you can get simple visualization such as this one:
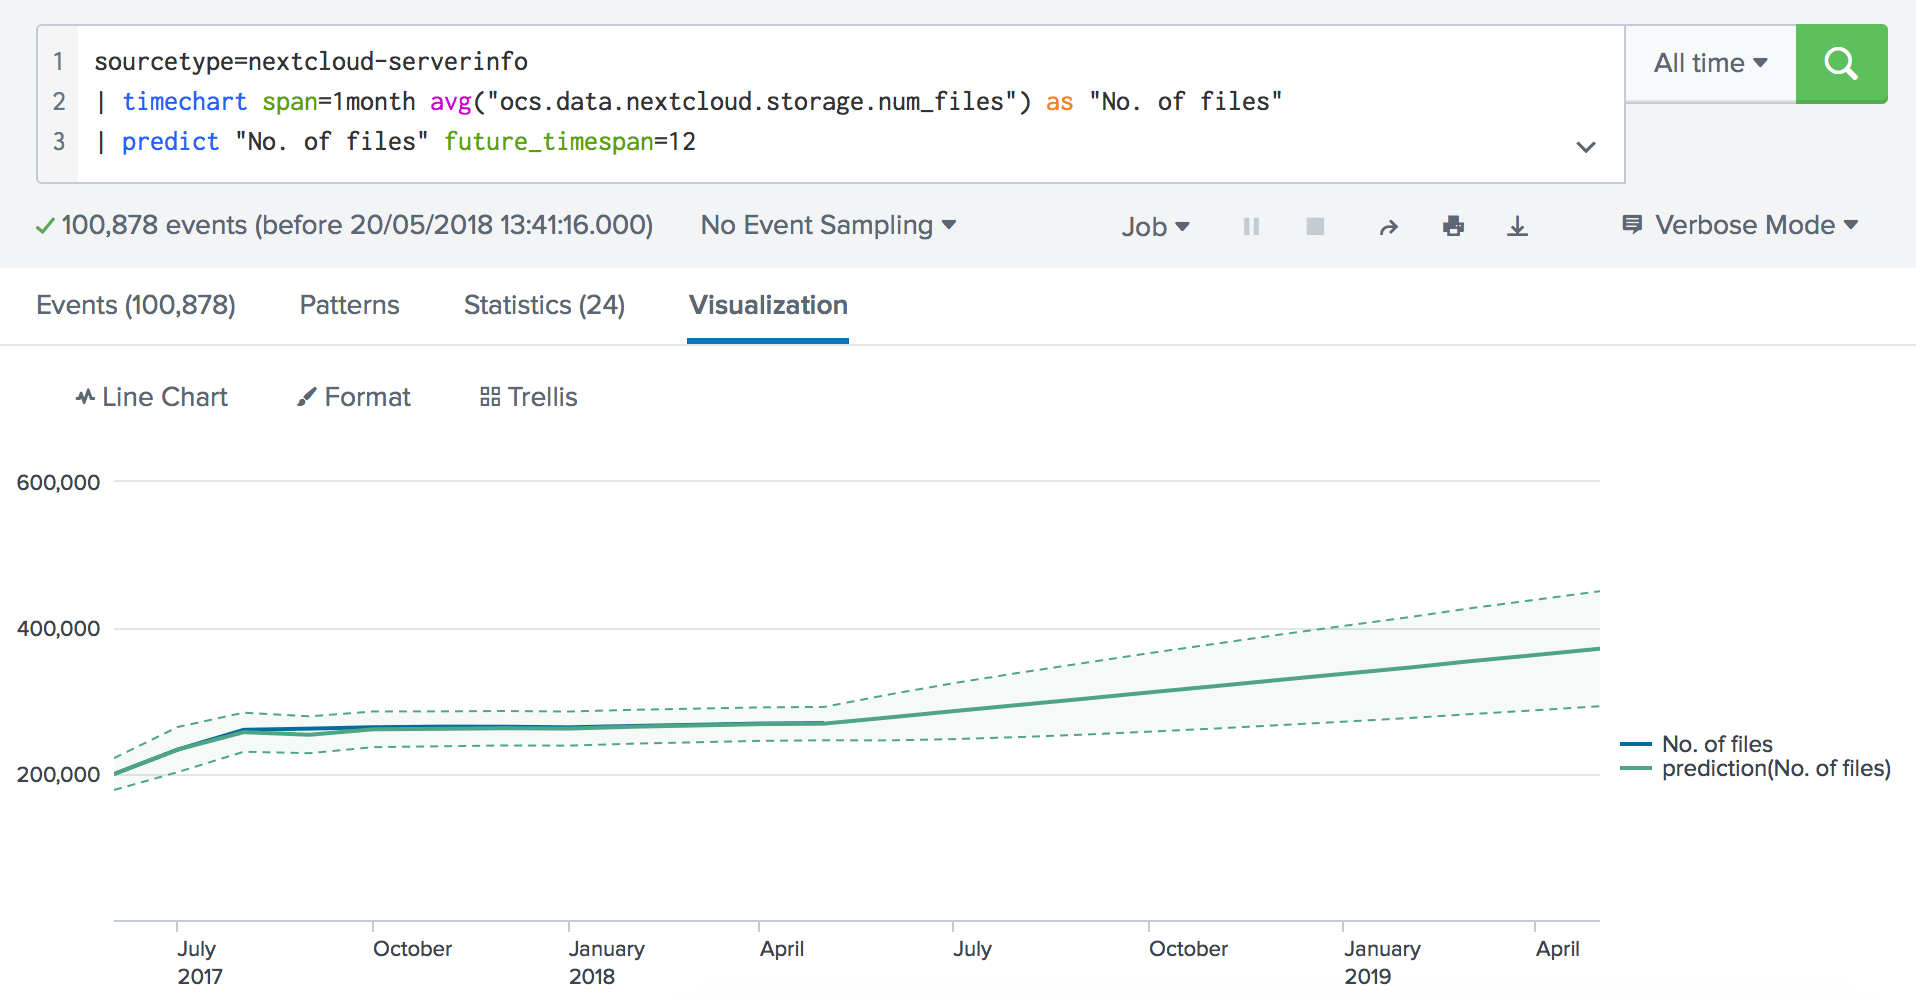
That long name (ocs.data.nextcloud.storage.num_files) comes from the data as delivered by Nextcloud, the rest are normal Splunk commands. How many files might the Nextcloud server be storing 12 months from now? Easy, predict it with the predict command (assuming you have enough historical data to base the prediction on).
Know a few Splunk commands, and it becomes super easy to visualize and analyze your data.
I do this for a living, I have still been amazed at the insights I’ve had from Splunking my own Nextcloud installation. At Splunk we often speak about delivering ‘aha’ moments from machine data, and there are plenty of ‘aha’ moments to be had from the Nextcloud data.
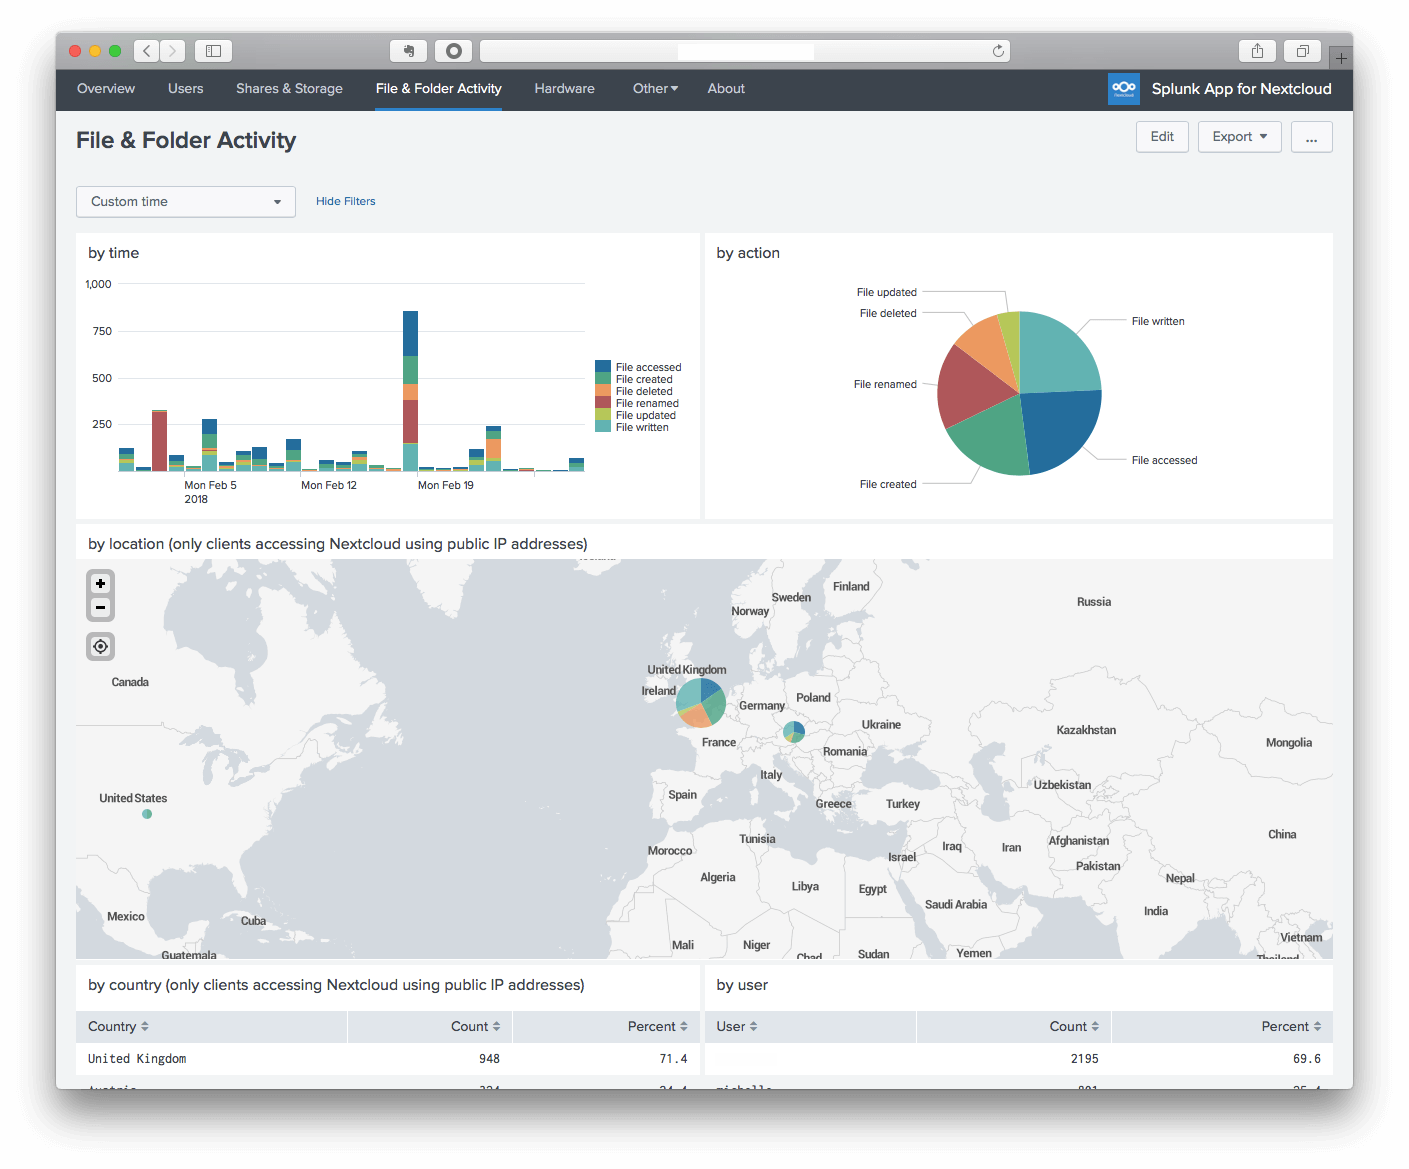
You don’t have to learn commands such as those above to get insights into your Nextcloud data. Search and visualization definitions can be stored in dashboards, and dashboards can be stored in Apps, and Apps can be installed on a Splunk server without having to know how the App does what it does. I’ve already created that App ready for you to use. With my Splunk App for Nextcloud you can view dashboards such as this one without having to know a single Splunk command:
Assuming you would now like to analyze your Nextcloud data, what do you do? Splunk isn’t open source, there is however a free version available. For the first 60 days it has all the functionality of a licensed version of Splunk, but after those 60 days some features are disabled. The most important feature that disappears is probably authentication. There are other limitations, such as how much data Splunk will ingest per day. After one year, my Nextcloud server (with 4 active users) has generated 350 MB of log data. Splunk Free allows up to 500 MB to be ingested every day, so unless you have thousands of users, those 500 MB of data per day should be enough.
To give you an idea of the effort required to make use of the Splunk App for Nextcloud, I’ve outlined the basic steps required here.
Except for the patience step, I reckon the whole thing can be done in less than one hour:
Enable the Nextcloud Auditing / Logging and the Monitoring apps.
Configure the loglevel in the config.php file on your Nextcloud server (the default doesn’t write enough information to be of use for analysis). Restart Nextcloud.
Download, install and start Splunk. Splunk is completely self-contained. Other than an operating system it does not require any other software components. The installation itself will probably take less than 2 minutes.
Install and configure the Splunk Add-on for Nextcloud and the Splunk App for Nextcloud. Restart Splunk.
If your Nextcloud server is on a separate machine from your new Splunk server, install a Splunk Universal Forwarder on the machine hosting Nextcloud. It is, however, not a deal breaker if you don’t, but not all dashboards in the app light up.
Configure the Universal Forwarder to, well, forward the nextcloud.log (and audit.log if your Nextcloud server is v14 or above) to the Splunk server.
Now arm yourself with patience. Whilst it is relevant to check whether data from Nextcloud is being ingested, you now need to have patience whilst Splunk ingests and stores data. Until you’ve got at least some hours’ worth of data, most of the dashboard are not going to be terribly exciting.
Splunk can be downloaded from https://splunk.com. Click on Free Splunk in the upper right corner.
The Splunk App for Nextcloud (and many other Splunk apps) can be found at https://splunkbase.splunk.com/app/3398/.
An install guide explaining (hopefully) everything you need to know to configure Nextcloud, install Splunk and the Splunk App for Nextcloud is available at https://intranet.graabek.com/cloud/index.php/s/Lc9oXkaWNmQHBqG.
Whoami?
I’m a Dane, now living near London. I’ve been in the IT industry since 1986. IT was just meant to be a temporary thing while I figured out what I really wanted to do. I ended up staying in the industry and it has been fun! It feels like I’ve done a bit of everything. That temporary job was supposed to be selling Commodore C64’s over the counter. My boss discovered I had taught myself programming, and I started developing small programs in Turbo Pascal for PC’s. A job change had me administrating an IBM S/36 minicomputer. A couple of jobs later and I was now a network support engineer. A few more job switches, and I had specialized in IT monitoring. Via an acquisition I ended up at IBM. I have now been at Splunk for three years where I lead a team of sales engineers.
In my spare time, sometimes I create Splunk apps (mostly for my own use, other than monitoring my Nextcloud server Splunk is also monitoring my solar panels and energy usage), but of course I also do non-Splunk things. The Splunk App for Nextcloud is a hobby project, and not an official Splunk project. In other words, don’t blame Splunk if it doesn’t perform how you believe it should. Things will get done as and when I’ve got the time and ideas.
Mit Nextcloud Hub 26 Spring feiern wir unsere Jubiläumsversion. Es bietet Ihnen noch mehr Auswahl bei den Tools, eine optimierte Benutzeroberfläche, reibungslose Zusammenarbeit und eine neue Plattformstrategie, durch die Entwickler:innen noch stärker von unserem umfangreichen Ökosystem profitieren können. Gemeinsam entwickelt, für die Zukunft konzipiert.
Nextcloud Hub 25 Autumn erleichtert Ihnen den Einstieg in eine leistungsstarke Zusammenarbeit, während Sie die vollständige Kontrolle über Ihre Daten behalten. Von globalen Design-Updates bis hin zu verbesserter Benutzerfreundlichkeit und Leistung – entdecken Sie unsere neueste Version in diesem Blog.
Nextcloud ist die erste Cloud-Plattform, die mit dem Umweltzeichen „Blauer Engel“ ausgezeichnet wurde und damit beweist, dass eine digital souveräne und grüne IT möglich ist.
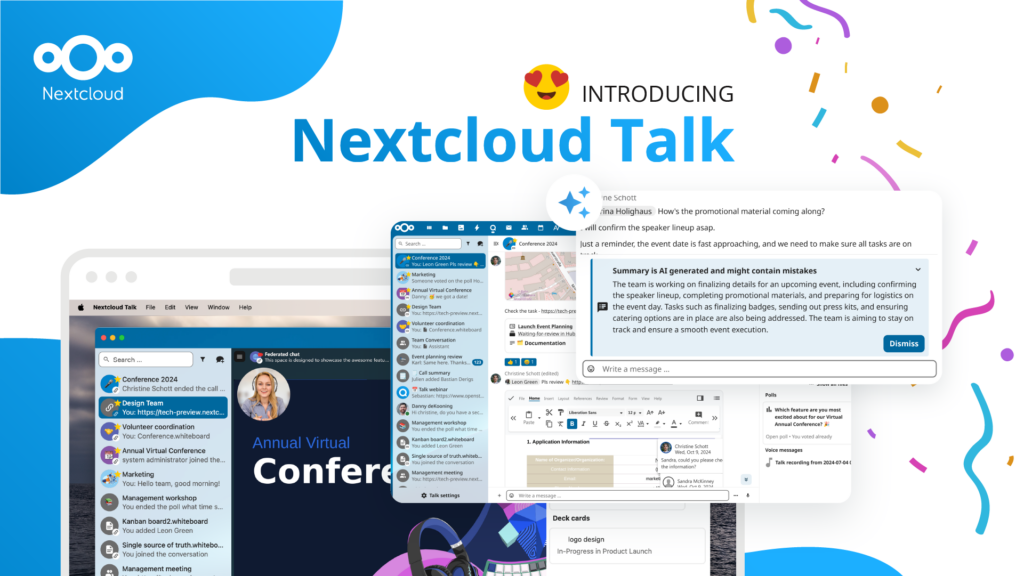
Unternehmen, ob klein oder groß, brauchen eine Möglichkeit, die Ausfallsicherheit und digitale Souveränität ihrer Abläufe zu gewährleisten - eine Open-Source-Alternative zu Teams, die die Privatsphäre respektiert. Und heute stellen wir diese Lösung vor - Nextcloud Talk.
Bechtle und Nextcloud kündigen heute eine vollständig verwaltete Kollaborationsplattform für den öffentlichen Sektor an, die keiner Ausschreibung bedarf und sofort bereitgestellt werden kann.
Our mission is to help individuals, businesses and organizations achieve digital sovereignty and regain control over their data. Nextcloud Hub 5 marks a massive step forward towards achieving this mission, putting the power of AI into your hands – in a way that keeps you in control. New release, new possibilities Hub 5 builds on […]
Euro-Office is gaining momentum with a clear roadmap focused on security, performance, and full ODF support. New coalition members, growing community contributions, and defined governance mark the next phase of building an open, sovereign office ecosystem.
Euro-Office is built on ONLYOFFICE, distributed under the AGPLv3. In this post we explain that certain additional terms in the source files conflicted with the AGPLv3, and what we did about it. Our reading is supported by the license authors themselves.
Wir speichern einige Cookies, um Besucher zu zählen und die Nutzung der Website zu erleichtern. Diese verlassen unseren Server nicht und dienen nicht der Verfolgung Ihrer online-Aktivitäten.
Weitere Informationen hierzu finden Sie in unserer Datenschutzrichtlinie. Anpassen
Statistik-Cookies sammeln anonym Informationen und helfen uns zu verstehen, wie unsere Besucher unsere Website nutzen. Wir verwenden cloud-gehostetes Matomo
Dienst:Matomo
Cookie-Beschreibung:
_pk_ses*: Zählt den ersten Besuch des Benutzers
_pk_id*: Hilft, die Besuche nicht doppelt zu zählen.
mtm_cookie_consent: Erinnert daran, dass der Nutzer seine Zustimmung zur Speicherung und Verwendung von Cookies gegeben hat.
Cookie-Ablauf:_pk_ses*: 30 Minuten
_pk_id*: 13 Monate
mtm_cookie_consent: 30 Tage