For good reasons, you decided to go for an open source solution but there are several different projects to choose from. Which one to pick? Here are four things to keep an eye on.
1. Health of the project
By far the most important question is: how healthy is the development of the product you’re about to deploy? If, shortly after you purchased, the vendor goes bankrupt or if the project has recently split and you’ve picked the dying half, your investment in money, time and effort has been wasted. Luckily the open nature of open source projects gives you easy ways to check the activity and health. Github in particular makes it very easy by providing you with some statistics. Let’s show some!
Pulse
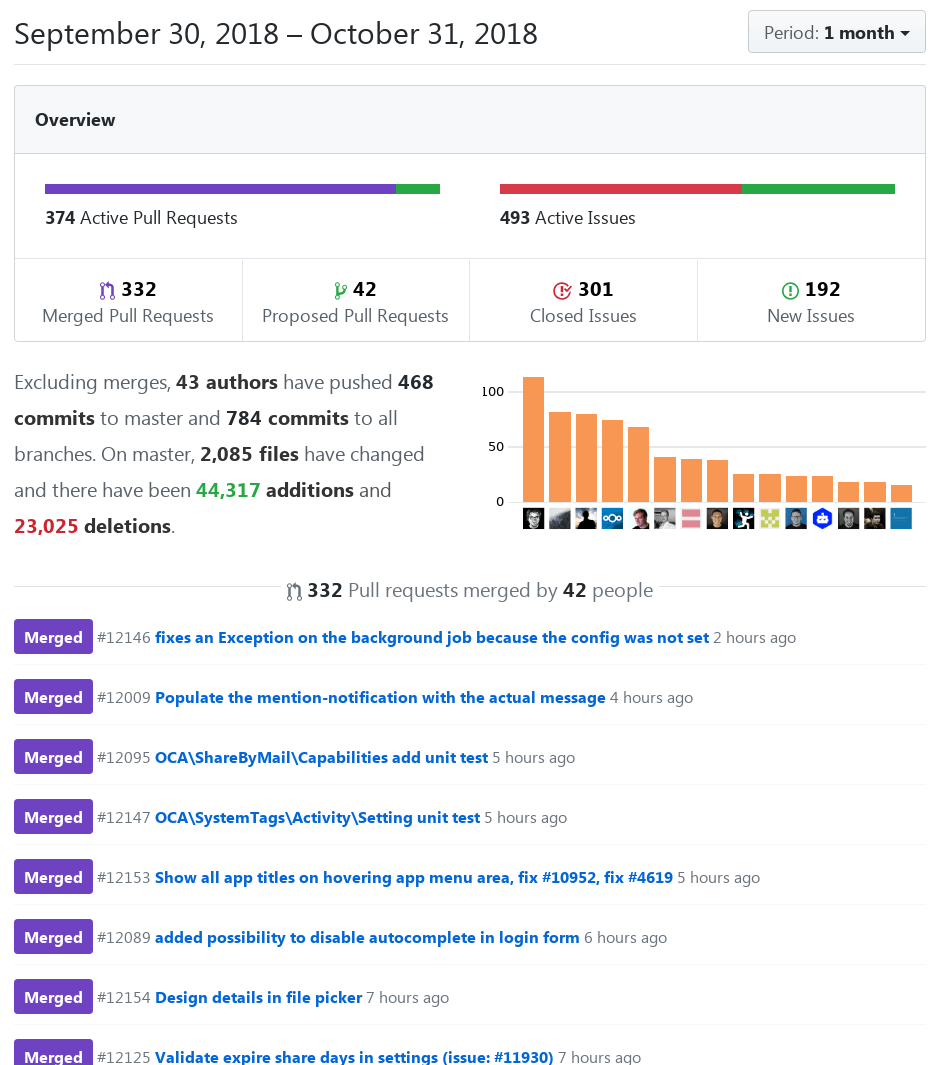
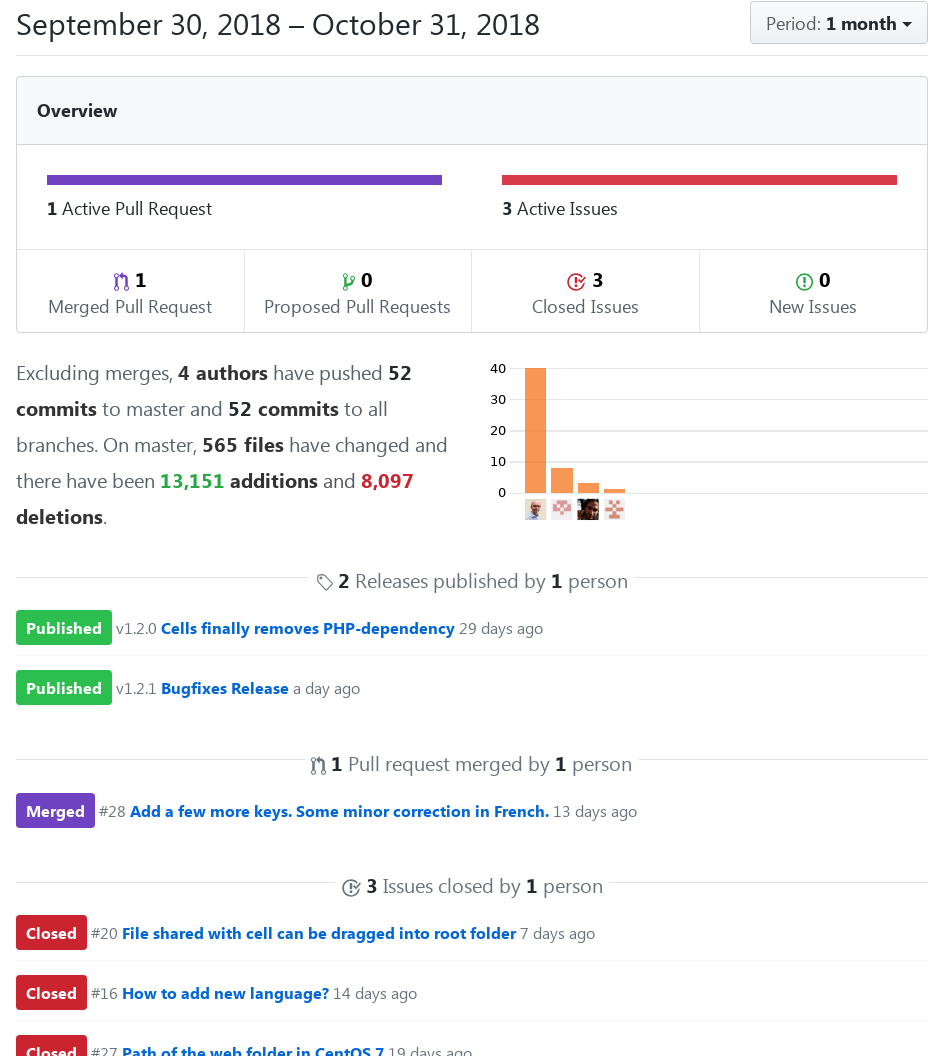
The first place to look for the health of a project is its ‘pulse’. Github shows you quickly how many people contributed and how much they did in the last week or month – you will find this section in every repository, under the tab “Insights”. Compare Nextcloud (left) with another file sync and share project*:
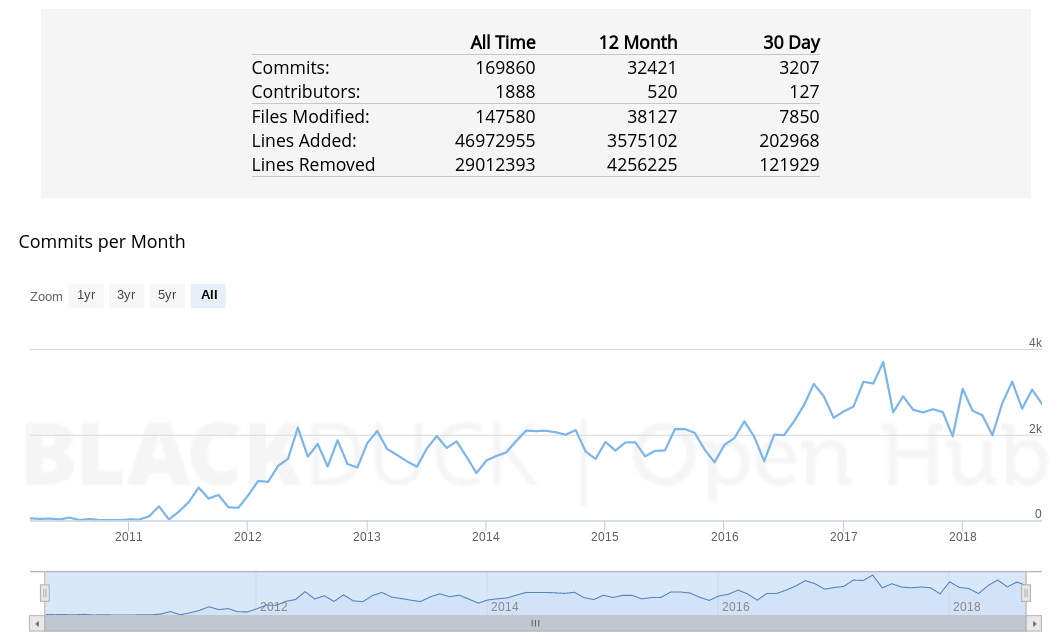
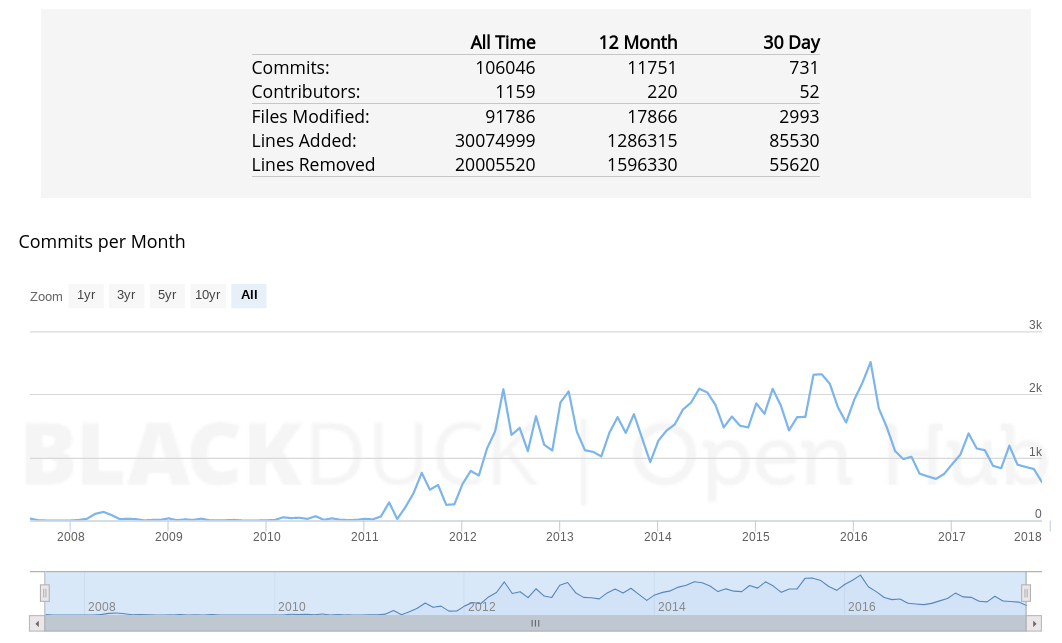
It would be much more risky to depend on the 2nd project for the security and stability of your operation! And remember, with proprietary vendors, things might be this dire without you seeing any signs of it… You might also want to make sure to look at WHAT is merged. For some projects you can see big numbers for merged pull requests while there are only a few commits merged in master. This is the case, for example, when you’re looking at the same code duplicated 3-4 times which is inflating the numbers – when changes are backported to a few releases. Obviously, backports are important, but they don’t say much about what or how much development takes place. Be sure to also look at the numbers: How many lines of code were added and removed? How many commits were made? How many people contributed?
Pulse is useful but it only gives a snapshot of a project over the last week or month. It also shows only one repository. It makes a lot of sense to try and get a longer term and more wide-ranging view of how things are going.
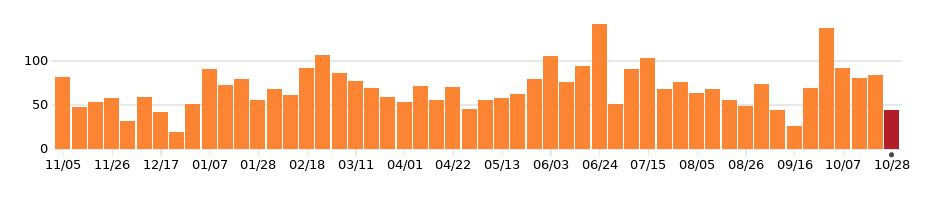
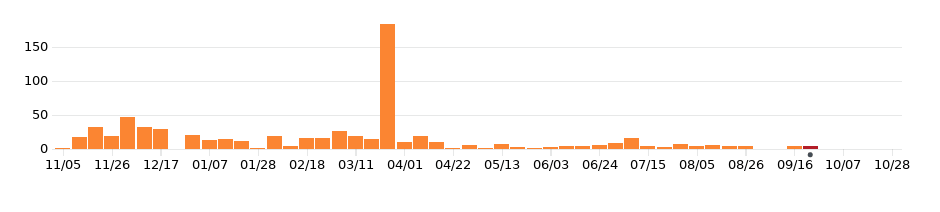
To get a more long-term view on a repository, you can see the Github commits activity page*. This will show you some useful information too: You can see that Nextcloud activity (top) is pretty regular, with peaks and valleys sometimes coinciding with releases, conferences and hack weeks. The other file sync & share project had a single big code dump, and hasn’t shown much activity in the last few months. Such code dumps, also seen repeatedly in some projects, is indicative of development-behind-closed-doors. That means you lose many of the benefits of open development!
OpenHUB
There are several caveats to be aware off with the statistics above. First, see the differences in scale. Second, you should look beyond the ‘primary’ repository. Most of these projects are quite modular and a lot of activity takes place outside the core. This is especially relevant when you look at the contributors as often, paid developers work more on the core and volunteers on functionality around it. Also, not every commit is the same, and some projects have a ‘throw-code-over-the-wall’ development model where they keep code internal until a release. A long gap can thus suddenly get filled up as commits made earlier are added to the public project, like in the last graph above.
So we will now introduce a source of information which gives a wider overview of a project, looking across repositories: openHUB*.
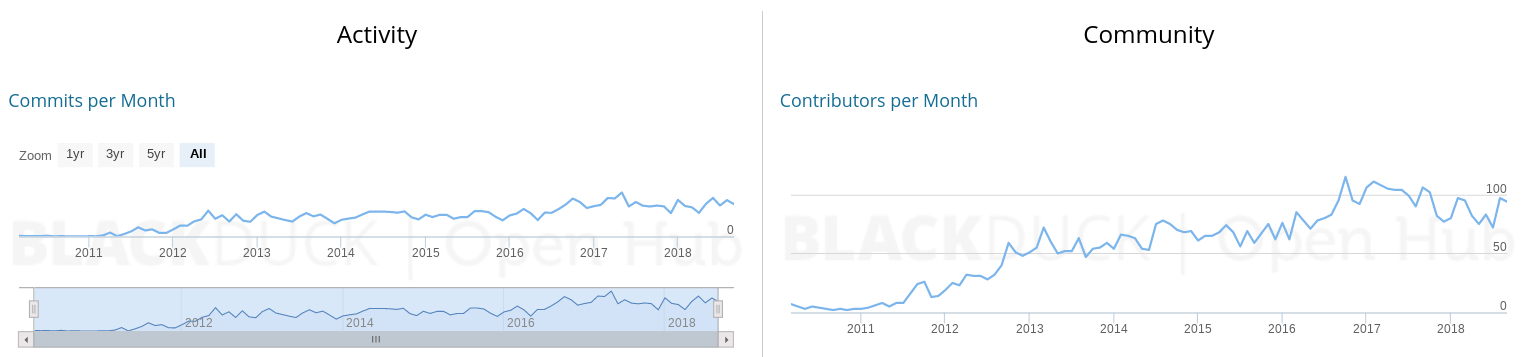
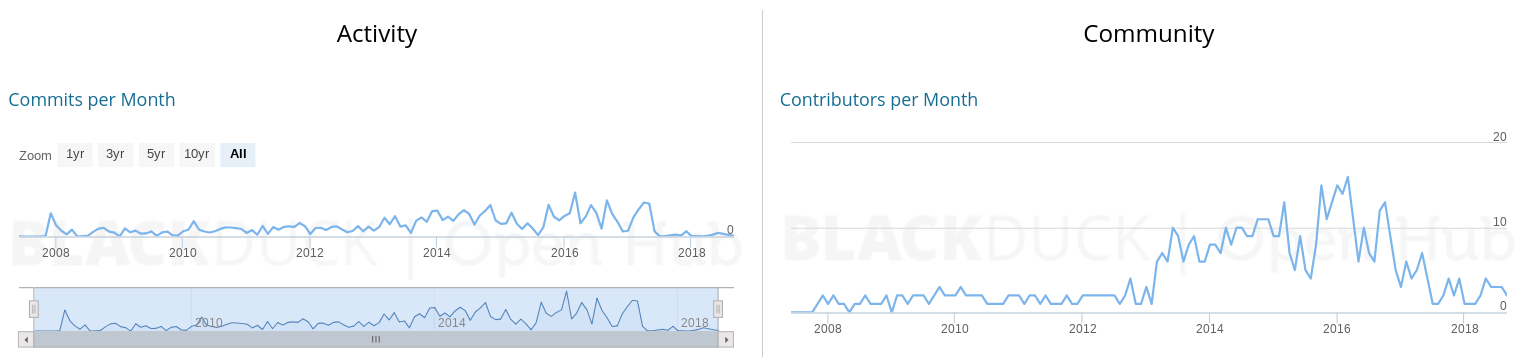
openHub shows statistics from an entire project and while not entirely accurate either (it is hard to keep track of all the repositories being added all the time to Nextcloud) it shows we’re doing really well! Here are graphs for Nextcloud (top) and for another file sync and share project (bottom). You see the trends visible on github here, too – Nextcloud has been growing fast since its inception, with a peak mid last year and a dip around the holidays (december/January 2017). A healthy rate of new people joining is important for the longevity of projects and Nextcloud does its best to mentor new contributors well, as was recently covered by Linux Magazine.
Of course all this commits and contributors-related data – whether it is from Github or openHUB – needs to be taken carefully. While they can give you precious information about the state of open source projects, don’t forget that it is not always possible to interpret such data properly without having access to additional information: Don’t take any single statistic as gospel!
2. Diversity of contributor base
An important factor to consider in choosing a product is its ecosystem. Is the project dominated by a single vendor? Is there a wide base of volunteers contributing? Are there other companies and institutions participating? Especially with ‘open core’ projects you typically don’t see much of an ecosystem and this adds to the many reasons why these ‘fake open source products’ are a bad choice.
So how to determine the diversity of the project? Some show statistics like OpenStack, where you see that more than X companies contribute while none added more than X percent of the code, showing a clearly decentralized community. Other projects like Nextcloud have a dominant corporate contributor alongside volunteers and smaller organizations participating while, as we noted, open core projects show the vast majority of code coming from the business.
You can see the number of contributors to a project on github and openhub both. Here two graphs that contrast two different projects and how they’re doing.
3. Licensing
We already mentioned open core so it would be good to dive deeper in licensing. Yes, it makes a difference what limitations are put on the product you buy. There are broadly speaking two types of open source licenses, permissive and ‘copyleft’ style licenses. The permissive licenses like MIT and BSD are very simple: You can do whatever you want with the code. This is great for a customer, IF you actually get the full code of your product. Sadly, these licenses often encourage vendors to add some ‘super special secret sauce’ to their products on top of the open core. You usually see them advertise a ‘Enterprise Edition’ in addition to a ‘Community Edition’, essentially Freeware. And while open core models seem open, Gartner rightly points out that customers of open core products lose all the benefits of open source. On top of that, it creates license risks, especially if you have community-developed apps which often can’t legally be combined with the proprietary Enterprise Edition. A better and safer choice are products with a pure ‘copyleft’ license as these have some strong protections built in for the customer, guaranteeing little or no vendor lock-in and offer well known and open licensing terms without a single party owning all copyright. You can read a little more about the licensing advantages in an earlier piece we published.
4. Is there support available?
Having one or many companies with the ability to support and consult around a product you deployed is important, even if you don’t need it now because you deployed that product in a totally non-business-critical area. In that unexpected (but actually quite frequent) situation where you suddenly find yourself deeply dependent on a product, you will have a phone number to call!
Be sure that you also pick the right company, one with serious expertise to ensure they can actually follow up on the promises every business makes on their website. For example, Nextcloud GmbH employs 8 of the 10 top contributors to the Nextcloud, making sure that any expertise needed to keep your business running is available when you need it. You can see a list of the most active contributors usually on the https://github.com/nextcloud/server/graphs/contributors page. Usually it makes sense to focus on the last year or so to make sure you get the current state of affairs. Clicking on the avatar of the contributors typically shows you who they work for.
Of course, when picking an open source project, you probably have your own criteria too, like features you really need, for example. But don’t forget! These aspects are essential when it comes to being able to truly rely on using a specific product in a durable way. Take some time looking into them! You won’t regret it.
* All according to statistics on Github and OpenHub. All statistics screenshotted on March 14th, 2018 or October 31, 2018. Note that not all commits are equal. Some change one line, others introduce whole features! Equally, pull requests can add a big feature or fix a one-line bug, or just backport the same code to an earlier release to fix a bug. In general, don’t take statistics as gospel but compare multiple numbers yourself to get an idea of what is really going on. Also, of course all trademarks belong to their respective owners and being mentioned here means in no way an endorsement for us of them or from them of us!
Oggi presentiamo Nextcloud Hub 26 Spring, la nostra versione celebrativa. Ti offre una scelta ancora più ampia di strumenti, un'interfaccia più curata, una collaborazione senza stress e la nuova strategia di piattaforma, che permette agli sviluppatori di sfruttare meglio il nostro vasto ecosistema. costruito insieme, progettato per il futuro
Nextcloud Hub 25 Autumn semplifica l'avvio di una potente collaborazione con il pieno controllo dei tuoi dati. Dagli aggiornamenti del design globale al miglioramento dell'usabilità e delle prestazioni, scopri la nostra ultima release in questo blog.
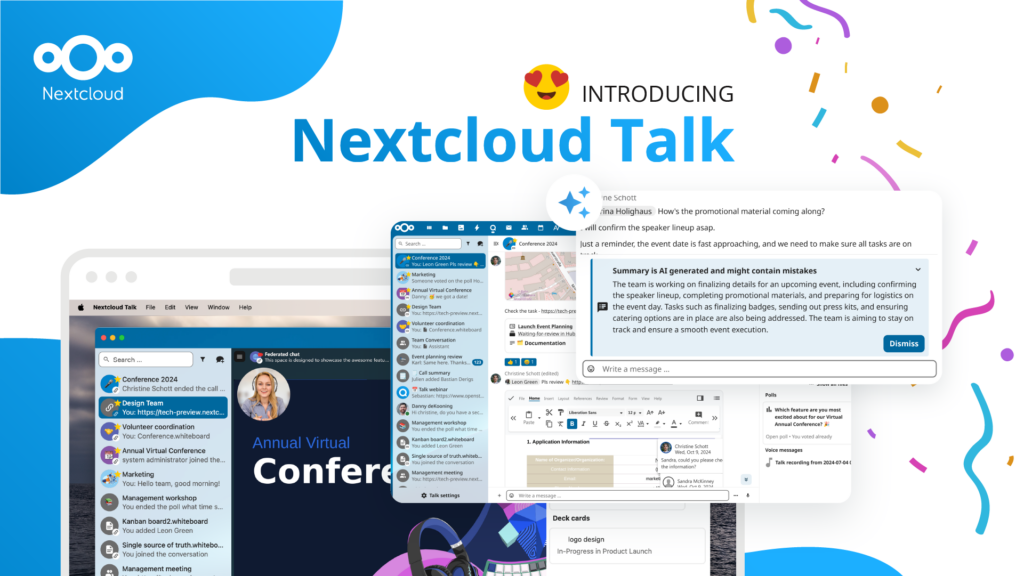
Le organizzazioni, grandi e piccole, necessitano di una soluzione che garantisca la resilienza e la sovranità digitale delle loro operazioni: un'alternativa open source e rispettosa della privacy a Teams. E oggi presentiamo questa soluzione: Nextcloud Talk.
Starting with Nextcloud AIO v13.3.1, you can register a free, automatically configured domain with DNS records via deSEC to streamline setting up your Nextcloud.
We are introducing the Nextcloud ISV Partner Program to support independent app developers through the Nextcloud app store. Read more in this article and get in touch with our team if you want to join the program.
Salviamo alcuni cookie per contare i visitatori e rendere il sito più facile da usare. Questi dati non lasciano il nostro server e non servono a tracciare il tuo profilo personale! Per maggiori informazioni, consulta la nostra Informativa sulla privacy. Personalizza
I cookie statistici raccolgono informazioni in forma anonima e ci aiutano a capire come i visitatori utilizzano il nostro sito web. Utilizziamo Matomo in cloud.
Servizio:Matomo
Descrizione del cookie:
_pk_ses*: Conta la prima visita dell'utente
_pk_id*: Aiuta a non contare due volte le visite.
mtm_cookie_consent: Ricorda il consenso alla memorizzazione e all'utilizzo dei cookie dato dall'utente.
Scadenza del cookie:_pk_ses*: 30 minuti
_pk_id*: 13 mesi
mtm_cookie_consent: 30 giorni